The eleven-click ZFS pool
This project started somewhere unglamorous: I was annoyed.
I am not an elitist about the command line. I don’t think everything needs to live in a terminal, and I have no interest in proving anything by refusing a GUI. But I kept running into the same wall with commercial NAS operating systems. Creating a single ZFS pool with Samba running and one directory shared took so many levels of pointing and clicking that it was genuinely faster to do it in the CLI and then use the web interface for occasional small edits afterward.
That would have been a fine compromise, except for what happens next. Most of these systems also lock down the CLI they just made you fall back to. Limited repositories, so you can’t install the software or drivers you need. And when they don’t lock it down, they’re fragile in a more insidious way: change something in an underlying config and the appliance’s own database no longer agrees with the machine. The UI starts showing you a system that doesn’t exist. Sometimes it stops working entirely.
The realization underneath all of it took me embarrassingly long to say out loud: the appliance’s database was the source of truth, and Linux was just something it happened to be running on. Every symptom follows from that one inversion. The CLI is dangerous because it edits the thing the UI isn’t reading. The repos are restricted because a package could change state the database doesn’t know about. The whole product has to be defensive, because it’s maintaining a parallel universe.
So I decided that, for me personally, I’d rather run a general-purpose Linux system for my NAS needs and build a user interface that uses and respects the actual underlying system, one that lets the real daemon configuration be the source of truth.
The system is the truth; the dashboard is a lens. The dashboard reads real state from zfs, systemctl, mdadm, lvs, smbd, and writes real config files that those daemons load. There is no shadow database of intent. If you edit smb.conf by hand at 2am, the dashboard shows you what you did, because it’s reading the same file Samba is.
That rule is why you can apt install anything you want on one of these boxes. Nothing I wrote is maintaining a fiction that a package could contradict.
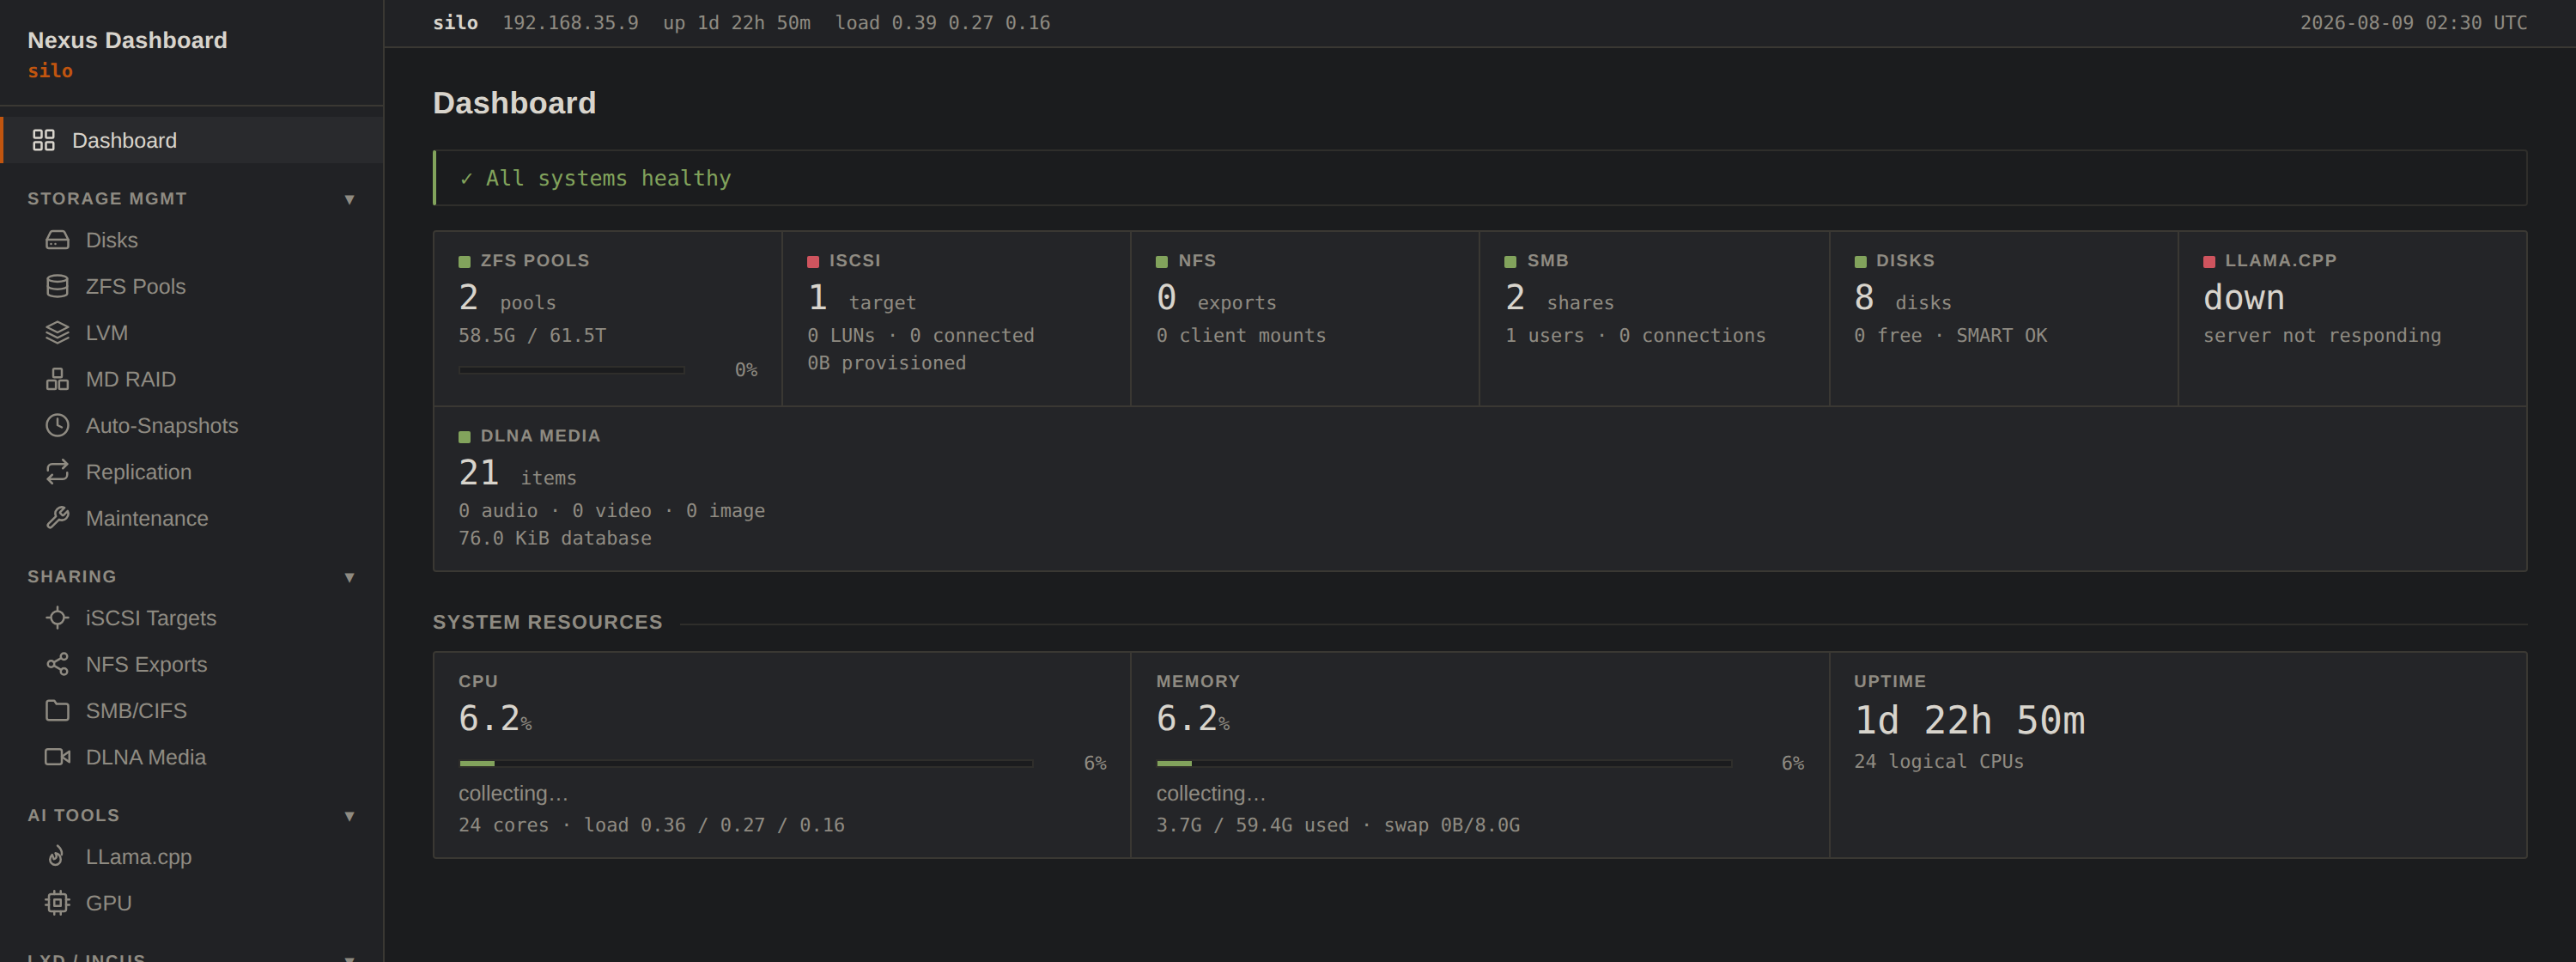
One node, one login, one page. Every number here was read from the running system a second ago (zpool list, systemctl, smbstatus), not from a database describing what the system was supposed to look like. The red llama.cpp chip is the same honesty in the other direction: this box isn’t an AI node, and the dashboard says so rather than hiding the card.
Scoping it down to what I actually needed
The temptation with a project like this is to build a NAS operating system, which is how you end up with the thing you were trying to escape. I scoped it to the services I actually run:
- Storage: ZFS, Linux software RAID (md), LVM, and raw disk management
- Sharing: iSCSI (via targetcli), SMB, NFS
- Streaming: one simple DLNA server (ReadyMedia/MiniDLNA)
That’s it: a user interface that could fully control exactly those services, on top of a normal Ubuntu LTS or Red Hat Enterprise Linux install. It’s an app you install on a server you already know how to run, rather than a distro or an appliance image.
The narrowness was the point. Every one of those services has a config file or a CLI with decades of documentation behind it, and rather than reinvent any of it, I was going to drive it, correctly, and stay out of the way.
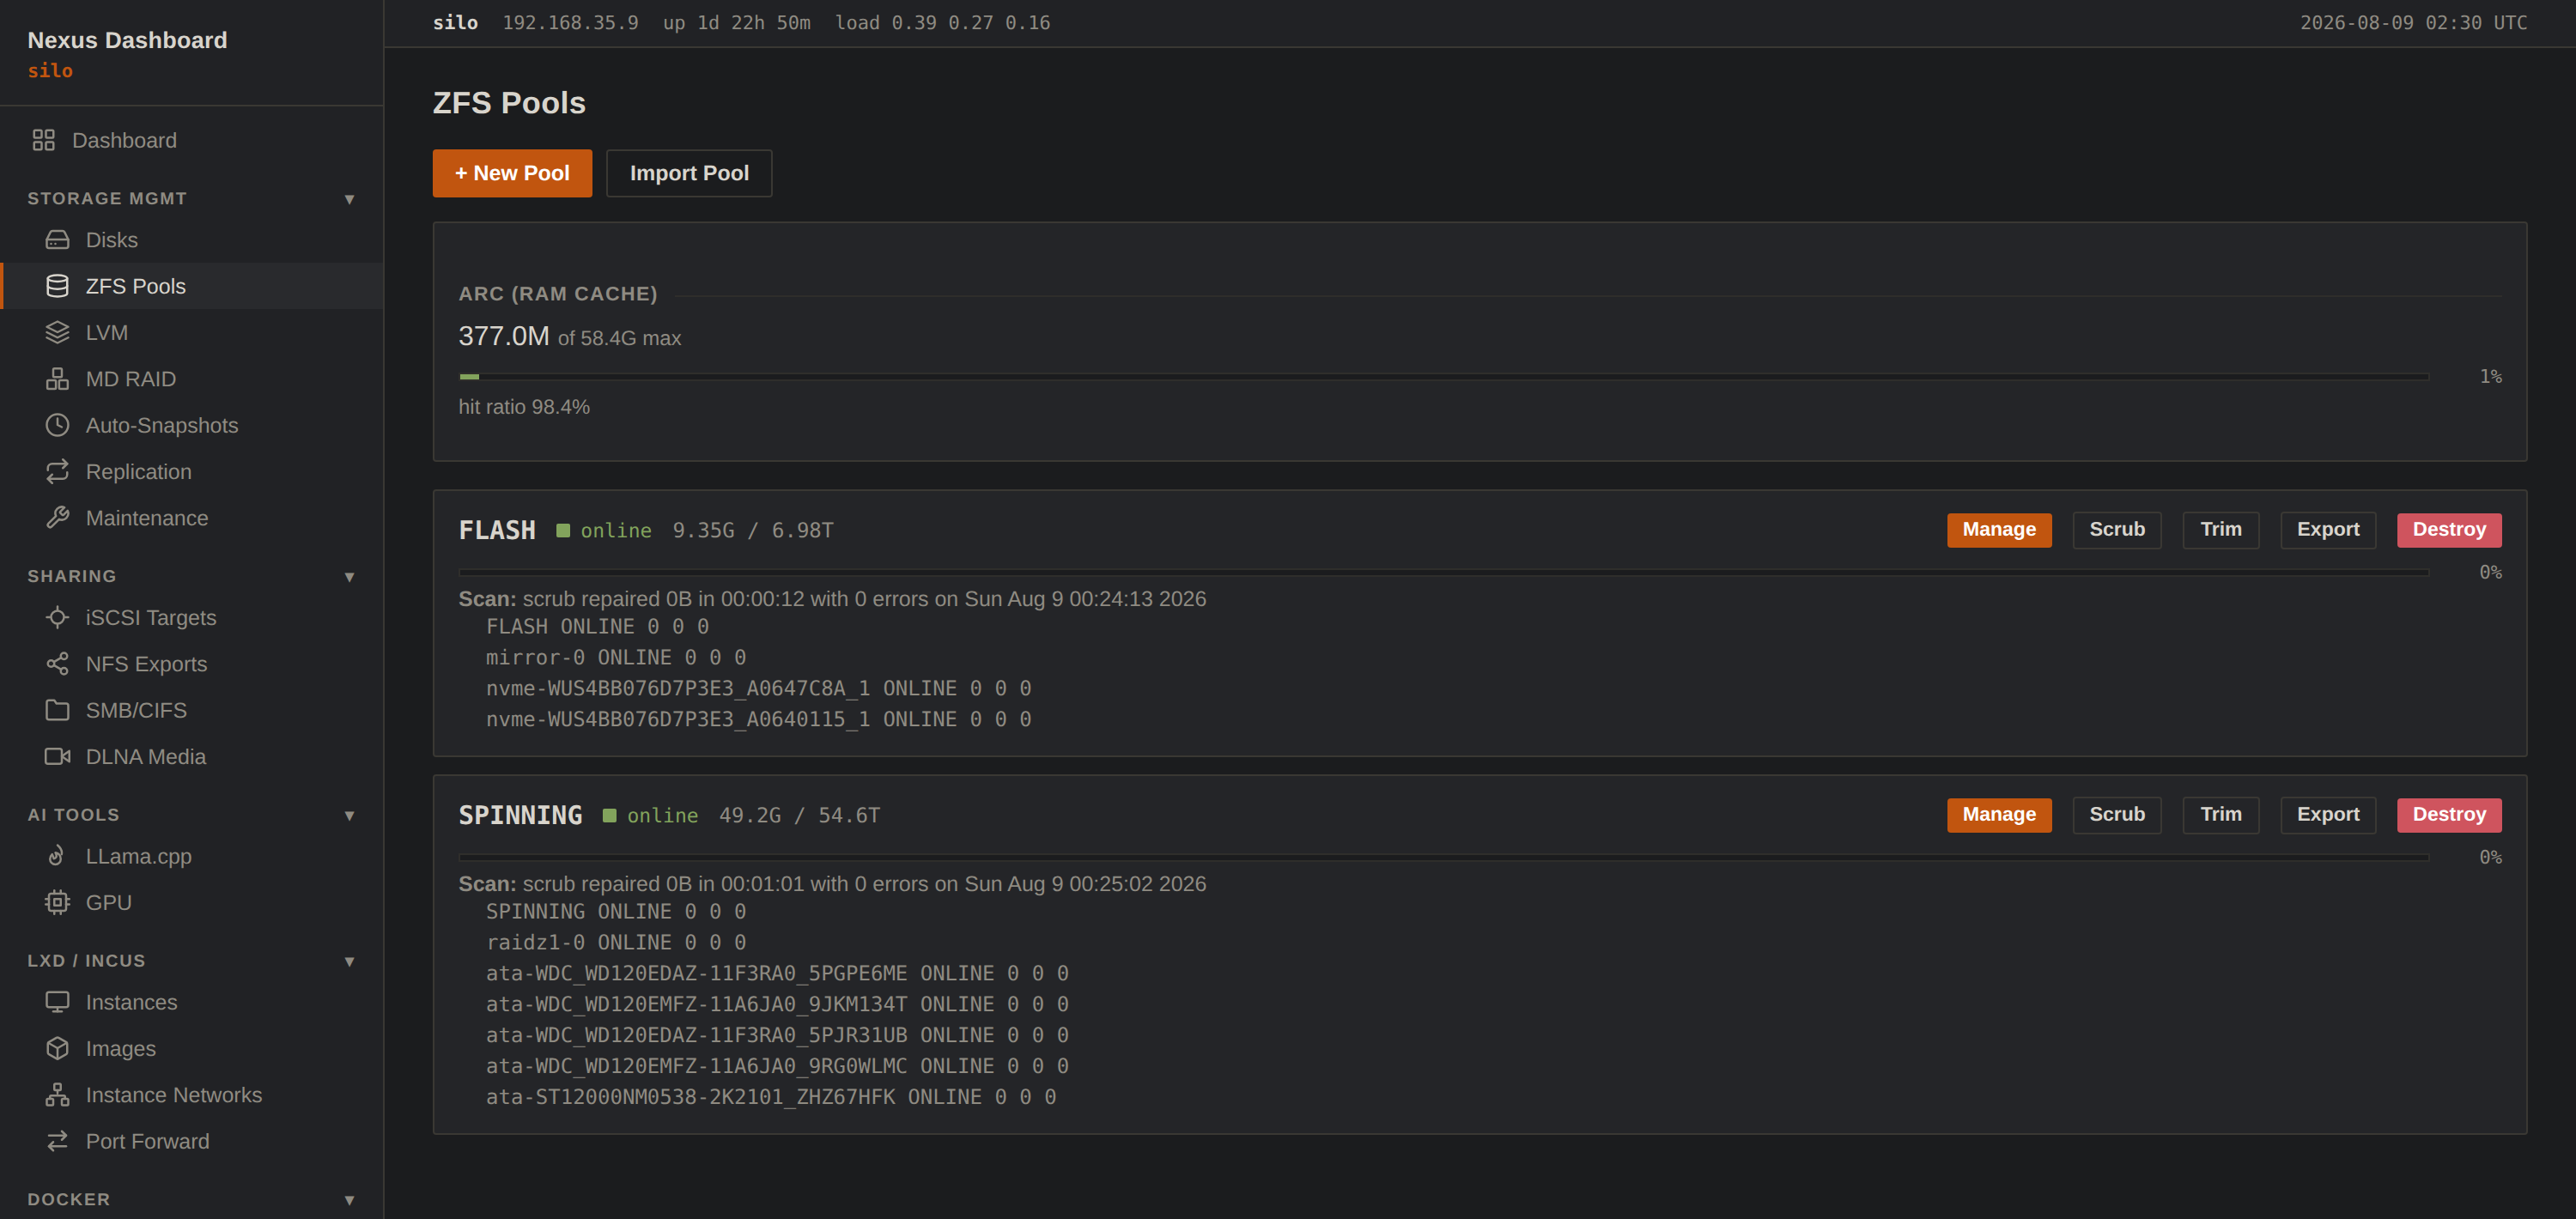
The ZFS page is zpool status with buttons. Pool topology, per-device error counts and the last scrub result are the daemon’s own words, passed through, which is exactly why a pool I created by hand in the CLI shows up here correctly, with no import step and nothing to reconcile.
The uncomfortable middle: a web UI that runs privileged commands
Here’s where the founding rule sends you somewhere serious. If the dashboard writes real config and drives real daemons, then it’s a web application that runs privileged system commands. That is exactly the shape of software that gets people owned.
I couldn’t hand-wave it, so the execution model became the first real design decision, and it’s the one everything else rests on:
| Decision | What it prevents |
|---|---|
Every command is an argument list, run with shell=False and sudo -n. There is no string that becomes a command line. | Classic command injection, categorically: there’s no shell to inject into. |
| Every user-supplied name is allowlist-validated against an anchored pattern before it reaches anything. | Path traversal, newline injection into /etc/exports and smb.conf, device-name games. |
| Sudoers are pinned to specific commands, or fronted by root-owned wrapper scripts the installer places. | The service account can do exactly its job and nothing adjacent to it. |
All config writes are atomic, and validated by the daemon’s own tooling first: Samba config through testparm, dnsmasq through dnsmasq —test. | Half-written config, and the special agony of a bad edit taking a service down remotely. |
| One audit choke point. Every mutation is logged from a single place, not per-handler. | The route somebody adds next year that forgets to log. |
The remote replication feature is the one I still think about. It runs ssh host zfs send …, and remote SSH arguments get joined and re-parsed by the remote shell: the exact trap the argv discipline protects you from locally, sprung again at the other end of the connection. The answer was to refuse the input rather than get clever about it. Dataset names are validated against a character class with no shell metacharacters in it, hosts and ports are validated, host keys are trust-on-first-use in a dedicated known_hosts, and it uses a dedicated key with BatchMode=yes. Nothing interesting can survive the trip.
The pattern I’d hand to anyone building this kind of tool: validate at the boundary, and let the daemon be your second opinion. The dashboard’s own allowlist rejects garbage early with a useful error, then Samba’s parser gets the final word before anything is installed. Two independent gates, neither one carrying the whole weight.
The firewall page manages ufw, which means a web UI that can block the port serving the web UI. It cannot. The dashboard’s own port is auto-allowed when you enable the firewall or set the default policy to deny (without ever widening an existing source-restricted rule), deny rules aimed at it are refused outright, and rule deletions are re-verified against the live table before they run. I’d rather write that guard once than drive to a machine.
From one box to a module system
Once it was running on the storage server, the obvious happened: I wanted it on everything.
I didn’t want the same features everywhere, though. An AI box wants llama.cpp and GPU controls, not iSCSI targets. A container host wants LXD/Incus and Docker. A front-door machine wants Caddy for TLS and proxying. My storage server doesn’t want any of that.
So the app became modular, and the important decision turned out to be the toggles rather than the modularity itself. Every node runs the exact same codebase, and a per-node module configuration decides what that node exposes. What you see when you log into a machine is a dashboard that only controls the services that machine was actually meant to serve.
+ plugins
toggles
SMB · NFS · iSCSI
toggles
storage hidden
toggles
Caddy front door
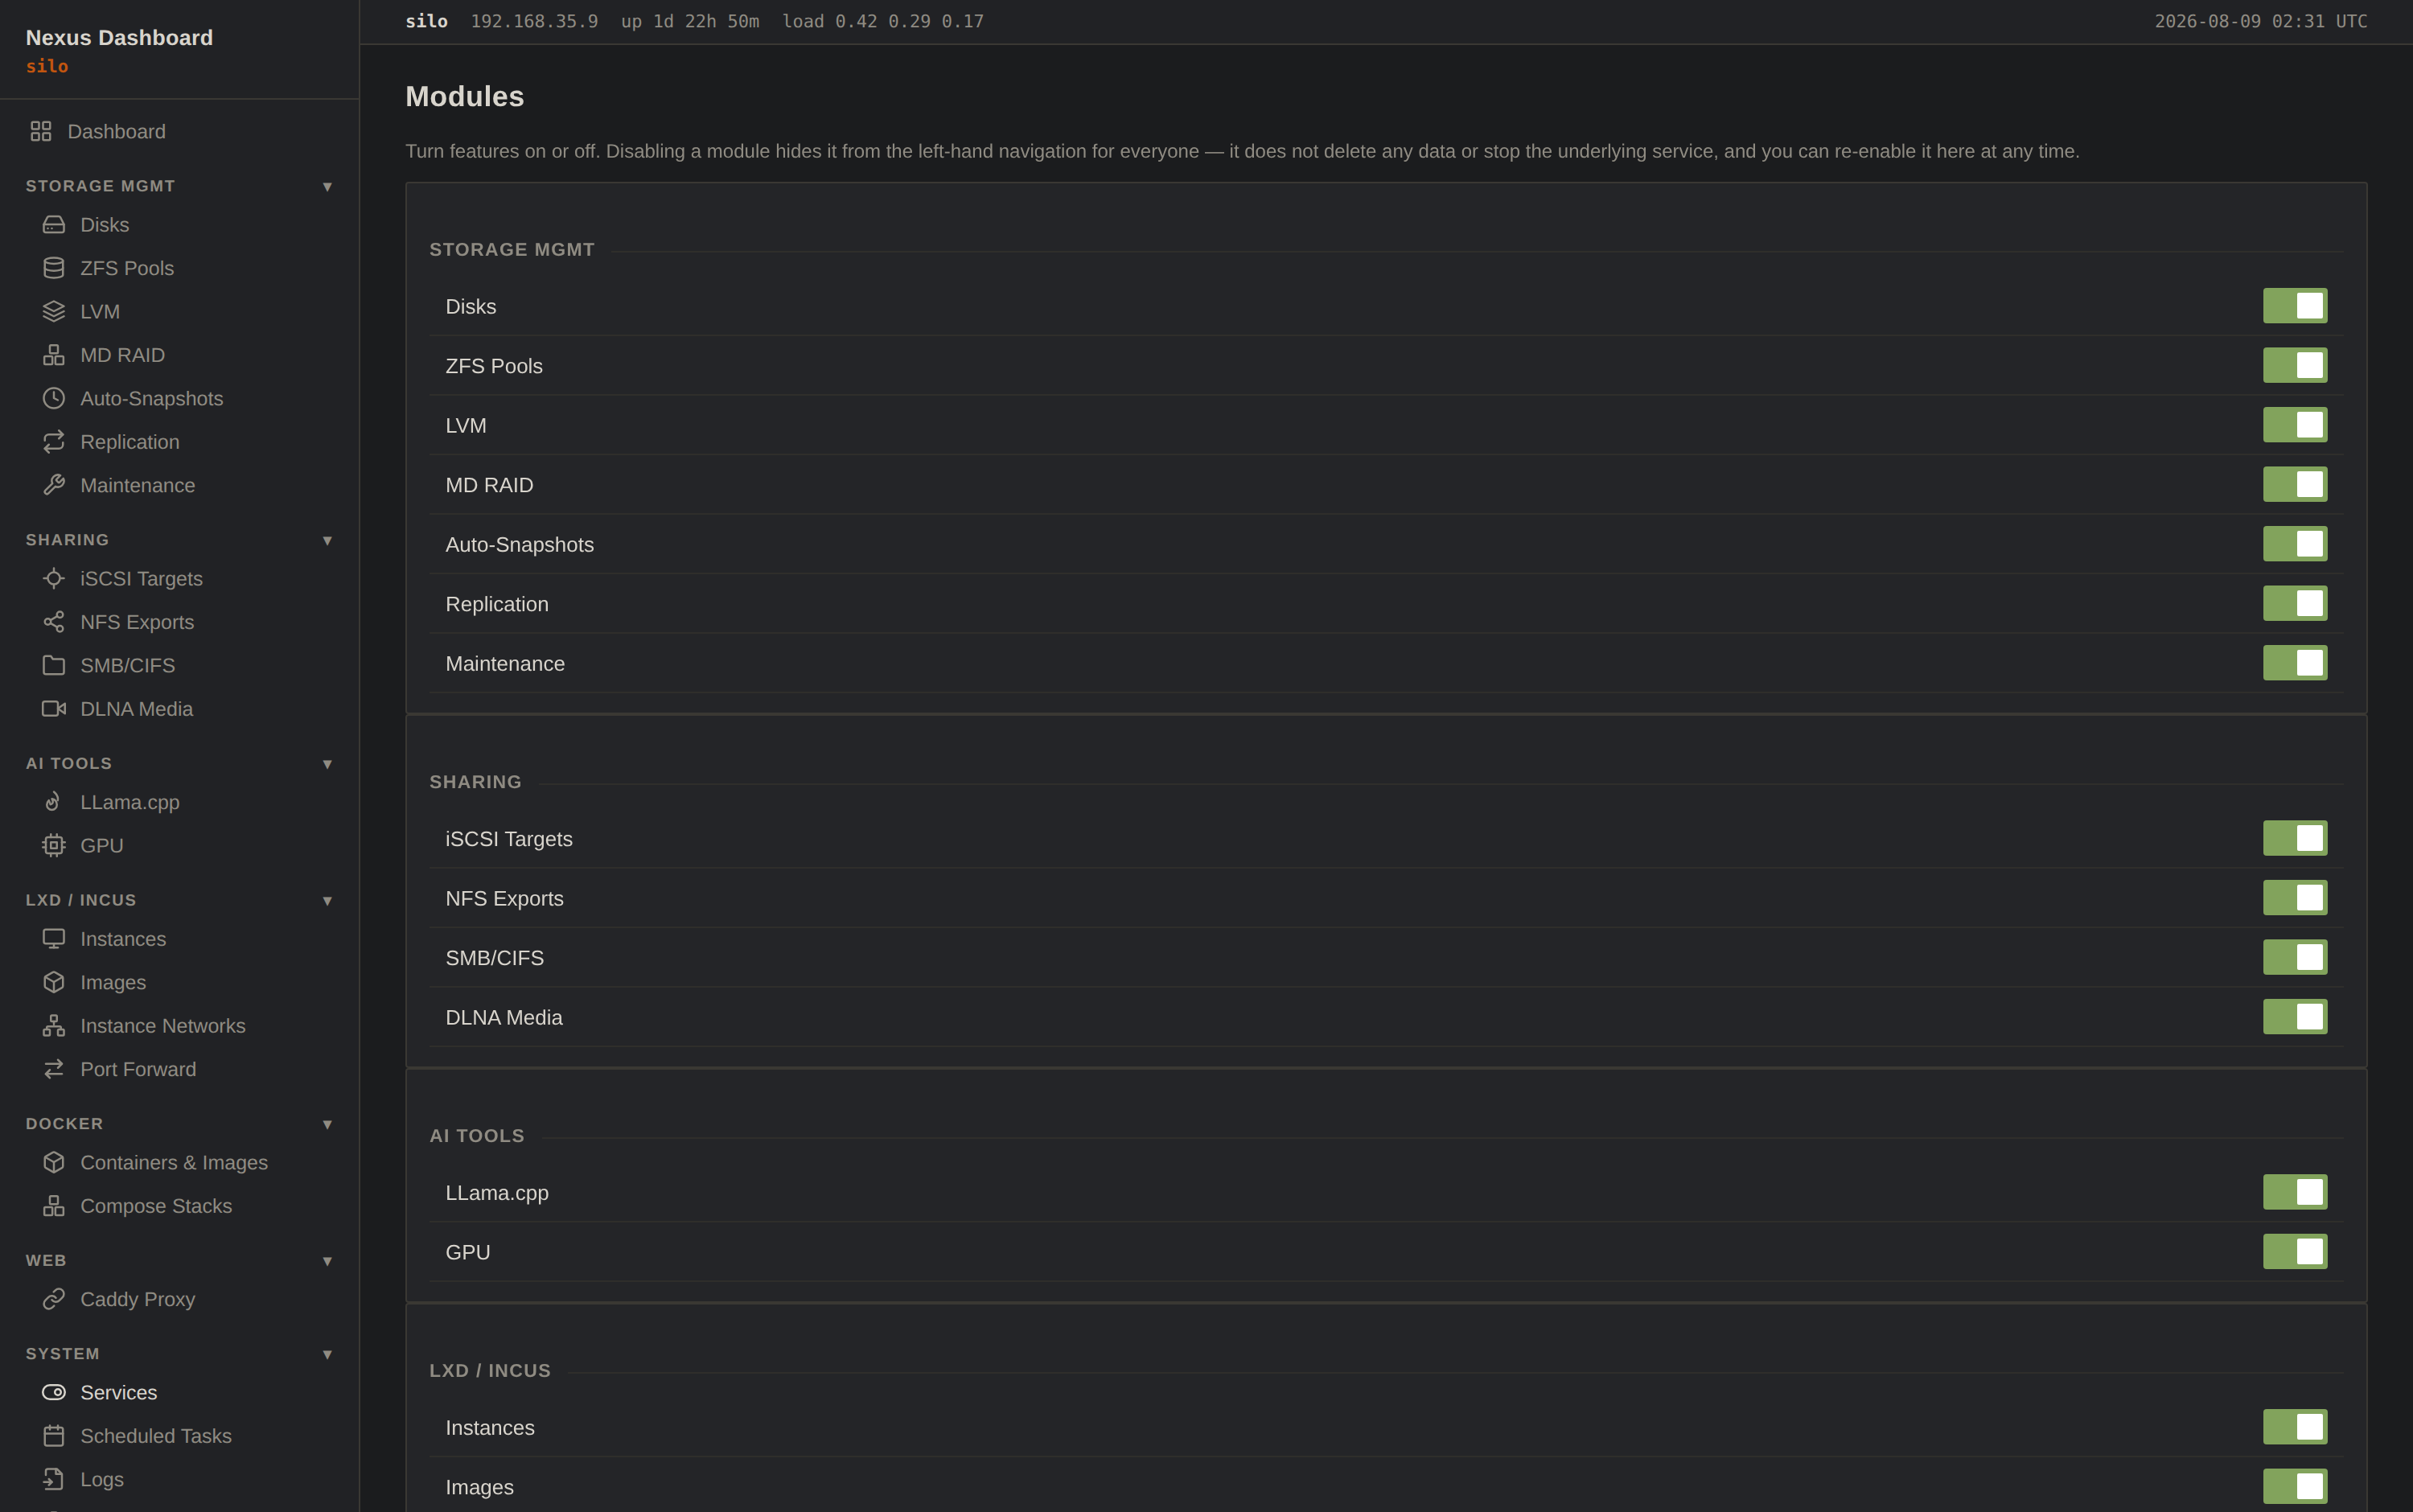
The Modules page is the whole architecture in one screen. Every feature the app has ever shipped is a switch, and the sidebar on the left is rendered from whatever is left on. This node is a storage box that also runs containers, so that’s the dashboard it has.
Disabling isn’t cosmetic. A disabled module’s API routes refuse immediately: the endpoint returns a clear “module is disabled on this node” rather than quietly doing the work for anyone who found the URL. Toggles apply live, in both directions, with no restart. Even core modules can be switched off.
The thing I’d underline for anyone refactoring a working tool: the hard part of modularizing was keeping the API intact rather than writing the modules. By that point other things depended on those endpoints, so the compatibility contract was absolute: every legacy endpoint stays byte-identical, every environment variable keeps its name, every CLI subcommand systemd invokes keeps its spelling. The test suite grew byte-identity golden files and a script that stands up two live instances and diffs their route maps, specifically so that a refactor that looks fine can’t quietly change a response.
The most recent version took it further: adding a module no longer touches any core file at all. The app discovers modules by scanning the package, classifies them by shape, and derives navigation, capabilities, and enforcement from the descriptors it finds. Which is what made the next part possible.
Plugins, and the case for a boring plugin format
I built for my own use cases, but I didn’t want to leave anyone else out in the cold. Your homelab has a service mine doesn’t. So there’s a plugin format. Drop a directory next to the app, restart once, and it registers exactly like a built-in: it shows up on the Modules page (disabled until you enable it), rides the same login, RBAC, audit and disable machinery, and its pages join the sidebar.
There are two tiers, and the split is deliberate:
- The declarative tier is a single
plugin.yaml. A service card, tables built from a command’s output, action buttons, a log tail. No code at all. - The Python tier is a module with full powers, for the cases YAML can’t reach.
The declarative tier is where the interesting constraint lives:
There is no string interpolation into a command line, and there are no parameters. Widgets address a command’s output by column index; the command itself is a fixed argv list written in the file. command[0] can never be a shell or a privilege tool. Need three variants of a command? Declare three widgets.
There is also no upload or edit API; plugin files are installed by root over SSH, never through the web UI. And the dashboard never installs sudoers rules on a plugin’s behalf. Fixed argv means you can grant exactly the one command, by hand, and know what you granted.
That’s a genuinely restrictive format, and I know it. It’s also the only version of “let strangers extend my privileged web app” I was willing to ship. A broken plugin can’t stop the app from booting either. It loads as a stub marked load failed, with the detail available to admins, and everything else comes up normally.
Eleven machines and no single pane of glass
Then I had the dashboard running on ten-plus machines and VMs, and discovered the new problem I’d made for myself: eleven excellent dashboards is not a fleet view, just eleven browser tabs and a memory test about which box does what.
So I added API token authentication to the node app and built Nexus Controller, a console that enrolls dashboards as nodes and drives all of them from one screen, regardless of which modules each has enabled.
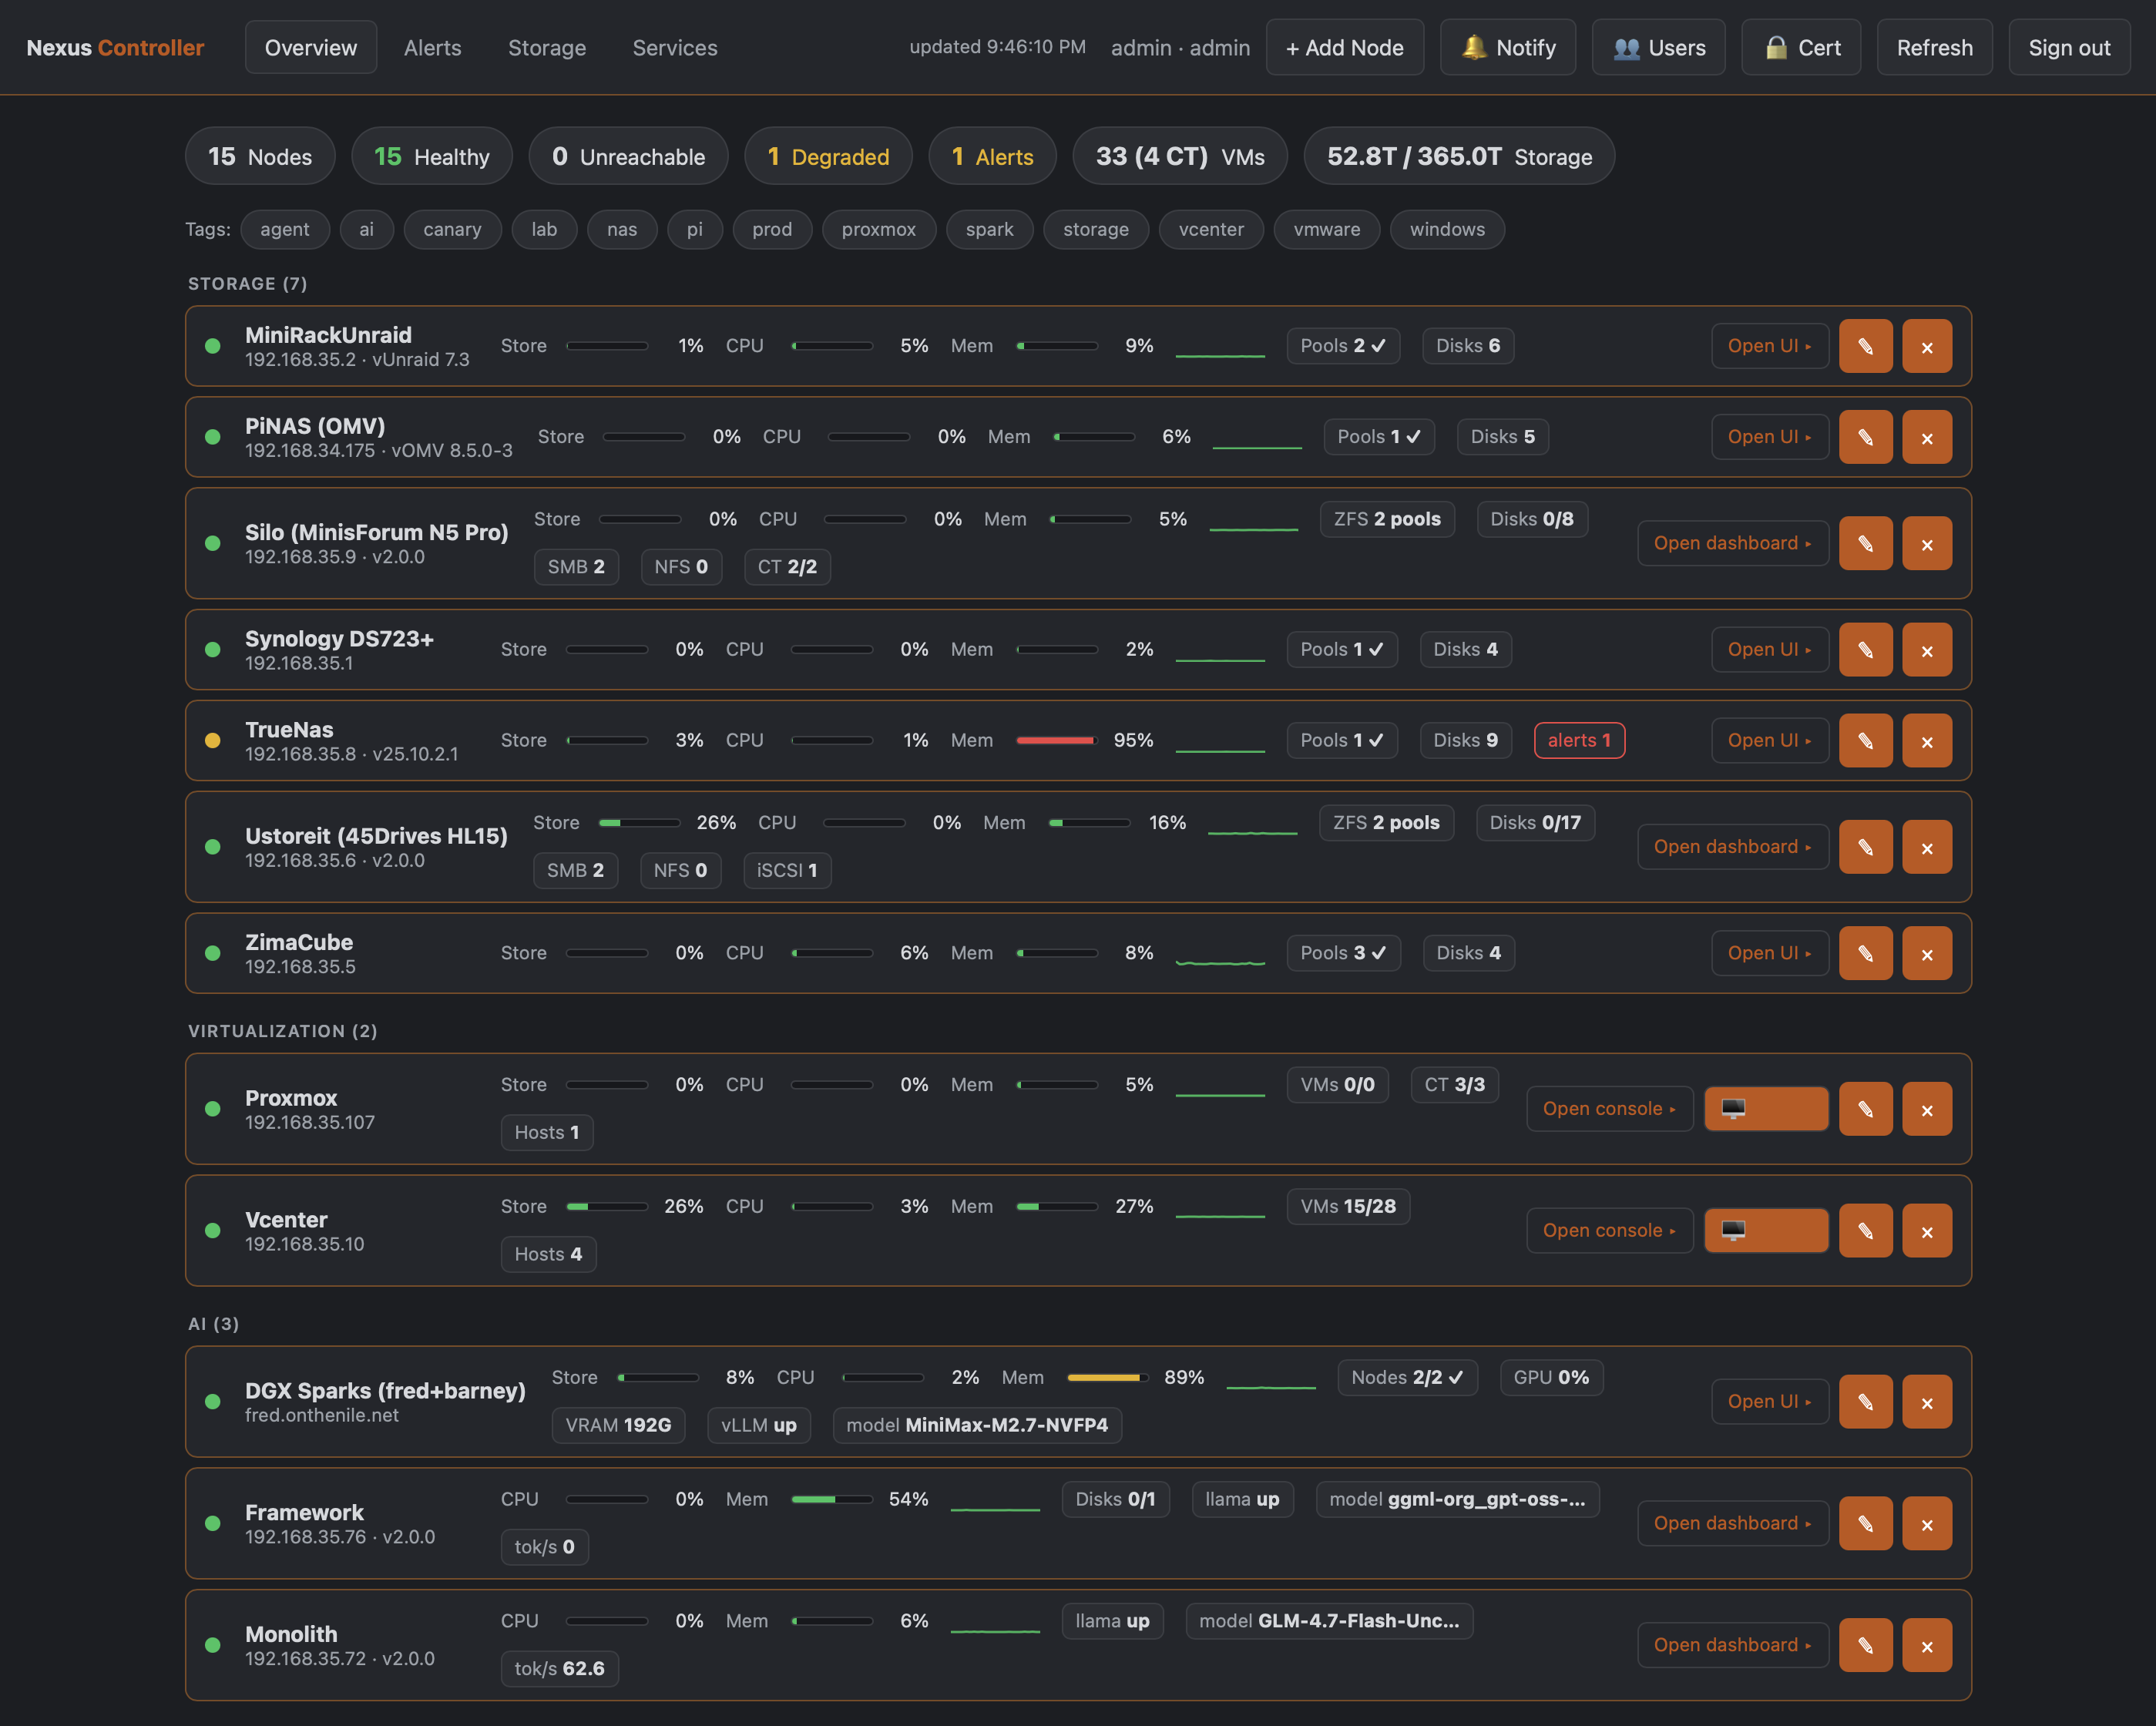
Fifteen hosts, grouped by what they actually are. Two of those rows are my own dashboards; the rest are an Unraid box, an OpenMediaVault box, a Synology, a TrueNAS, a ZimaCube, Proxmox, vCenter, a DGX Spark cluster and a couple of llama.cpp machines, each one reached through its own native API and flattened into the same row shape. The amber dot and the red memory bar are a TrueNAS having a bad night.
The architectural decision that mattered most was made in the first hour, and it’s a decision about what the controller doesn’t get to do:
The controller needs no root, no sudo, and no shell-outs. It only ever speaks HTTPS to nodes. Every privileged operation still happens on the node, behind that node’s own authentication, RBAC and audit trail.
The controller is the thing that can reach every machine in the house. Far from being a sacrifice, making it the least capable component in the system is the entire security argument.
It’s also why the controller containerizes cleanly and the node app doesn’t. The node shells out to zfs and systemctl because that’s its job; the controller has no host dependencies to speak of, so it drops into Docker without a single mount.
Communication is pull-only. The controller calls nodes; nodes never call back and store no reference to the controller at all. That has a lovely practical consequence: I can move the controller, re-address it, rebuild it in a container, and there is nothing to re-enroll. It also means a node that’s compromised has no channel to the controller to abuse.
one browser tab
session + RBAC
no root, no sudo
per-node timeout
cert-pinned TLS
Three mechanisms make the fleet view survive reality:
Parallel fan-out with per-node timeouts. A rollup calls every node concurrently with a short timeout. One node being wedged makes one row unhappy; it does not make the page hang. Results are cached for a few seconds so auto-refresh doesn’t hammer the fleet, with an explicit refresh that bypasses the cache.
Trust-on-first-use certificate pinning, asserted in-handshake. Every node’s certificate fingerprint is captured at enrollment and verified on the same connection that carries the request, rather than checked first and then connected again, which is a race with a name. A changed certificate fails closed. When it changes for a legitimate reason, admins get a review screen showing pinned versus now-serving side by side; and re-pinning is refused if the certificate changed again between review and click, rather than blindly trusting whatever is there now.
Encrypted secrets that never come back out. Node tokens and appliance passwords are encrypted at rest and stripped from every API response. The browser never sees a node token, ever, and that is what makes the next feature safe.
Drill-in: the feature that decided the whole shape
The controller isn’t meant to replace the dashboards. Fleet views are for noticing; the real work still happens on the node. So “Open dashboard ▸” serves the node’s own single-page app through the controller: the node’s token is attached server-side, the browser is never given a credential, and every action is audited on the controller in addition to the node’s own trail.
It’s a reverse proxy with a retargeting shim rather than a fork of the node UI. That matters, because a forked UI would have started drifting the day I wrote it. That includes the websocket console. Open a container’s shell from the controller and you get a real terminal, bridged with the node’s token attached server-side.
This is where the two projects stop being “a tool and another tool” and start being one system. The node is the complete, standalone, fully-featured interface. The controller is a lens over all of them that can hand you the real thing at any moment without asking you to log in again or exposing a credential to do it.
And then it spun out of control
Once the controller could enroll a Nexus node, the obvious question was why it couldn’t enroll everything else. My homelab has things that will never run my dashboard.
The answer was to restructure host support into an adapters package, one self-contained module per host type. Each adapter probes for enrollment, fetches into a shared envelope shape, and describes its own enrollment UI: which credential fields to show, what to label the secret, what the placeholders say. The frontend fetches those descriptors and builds the Add Host modal from them. Adding a host type is one new module and one line in a registry, with no route changes and no frontend changes.
That decision is why the list got long:
| Host type | How it’s reached | What the fleet row shows |
|---|---|---|
| Nexus Dashboard node | API token, pinned TLS | Full integration: storage, shares, services, alerts, guests, drill-in |
| Proxmox VE · vCenter · ESXi | username + password | Hosts, running/total VMs & containers, CPU/RAM, datastores, guest power control |
| TrueNAS SCALE / CORE | read-only API key, JSON-RPC over WebSocket | Pool health, disks, capacity; amber on a degraded pool |
| Synology · Unraid · OpenMediaVault · ZimaOS | each vendor’s own web API, read-only calls | Volumes and arrays as pools, disk and SMART problems as alerts |
| Any Linux or Windows box | Nexus Agent: one stdlib Python file, or a PowerShell script | Up/down, CPU, memory, per-mount storage. No write endpoints at all. |
| DGX Spark clusters | SparkDash instance | Nodes online, GPU utilization, VRAM, vLLM health and loaded model |
| DNS/DHCP appliances | read-only API token | Service state, cache hit ratio, active leases, primary/secondary mirror role |
The agents deserve a note, because they’re the piece I’m quietly happiest with. Not every machine warrants a full dashboard. So for those, there’s a single dependency-free Python file plus a systemd unit on Linux, or a PowerShell script and a Scheduled Task on Windows. Both speak the same read-only contract over HTTPS: a bearer token, a self-signed certificate the controller pins on first contact, and endpoints for up/down, CPU, memory and per-mount utilization. No write endpoints exist, so there is nothing to abuse even if someone got the token. A machine that only needs to be noticed shouldn’t require an attack surface to be noticed.
What the pair does that neither does alone
The interesting capabilities live in the seam between them:
- Fleet-wide actions. Restart a service everywhere, or only on hosts tagged
prod, with per-node success and failure reported back. Each action still lands on the node as an ordinary authenticated API call, audited on both sides. - A services matrix. Node × service, with a status dot in every cell. It’s the view I use most, and it’s only possible because every node exposes the same shape.
- History and capacity forecasting. A rolling thirty-day buffer samples every host each minute. Overview rows get CPU sparklines; the storage view projects days-to-full per pool from the observed fill rate, and availability percentage per host. That’s a question nobody answers by looking at a single machine.
- Push notifications on state transitions. A background monitor watches the fleet and posts transitions (host down, pool degraded, new alert, certificate changed, version drift) to a chat webhook, debounced against flapping, with all-clear messages when things recover. Alerting on states rather than transitions is how you train yourself to ignore a channel.
- Version-skew detection. The node app publishes its version and capabilities; the controller notices when a node trails the newest one in the fleet and flags the row. Ten hosts drift silently, but eleven hosts with a controller do not.
- Tag-scoped logins. An operator or viewer account can be confined to hosts carrying certain tags. A scoped account’s fleet view, history, rollups and actions contain only its hosts; everything else returns a 404, enforced server-side, not hidden in the UI.
Three things that only became obvious in production
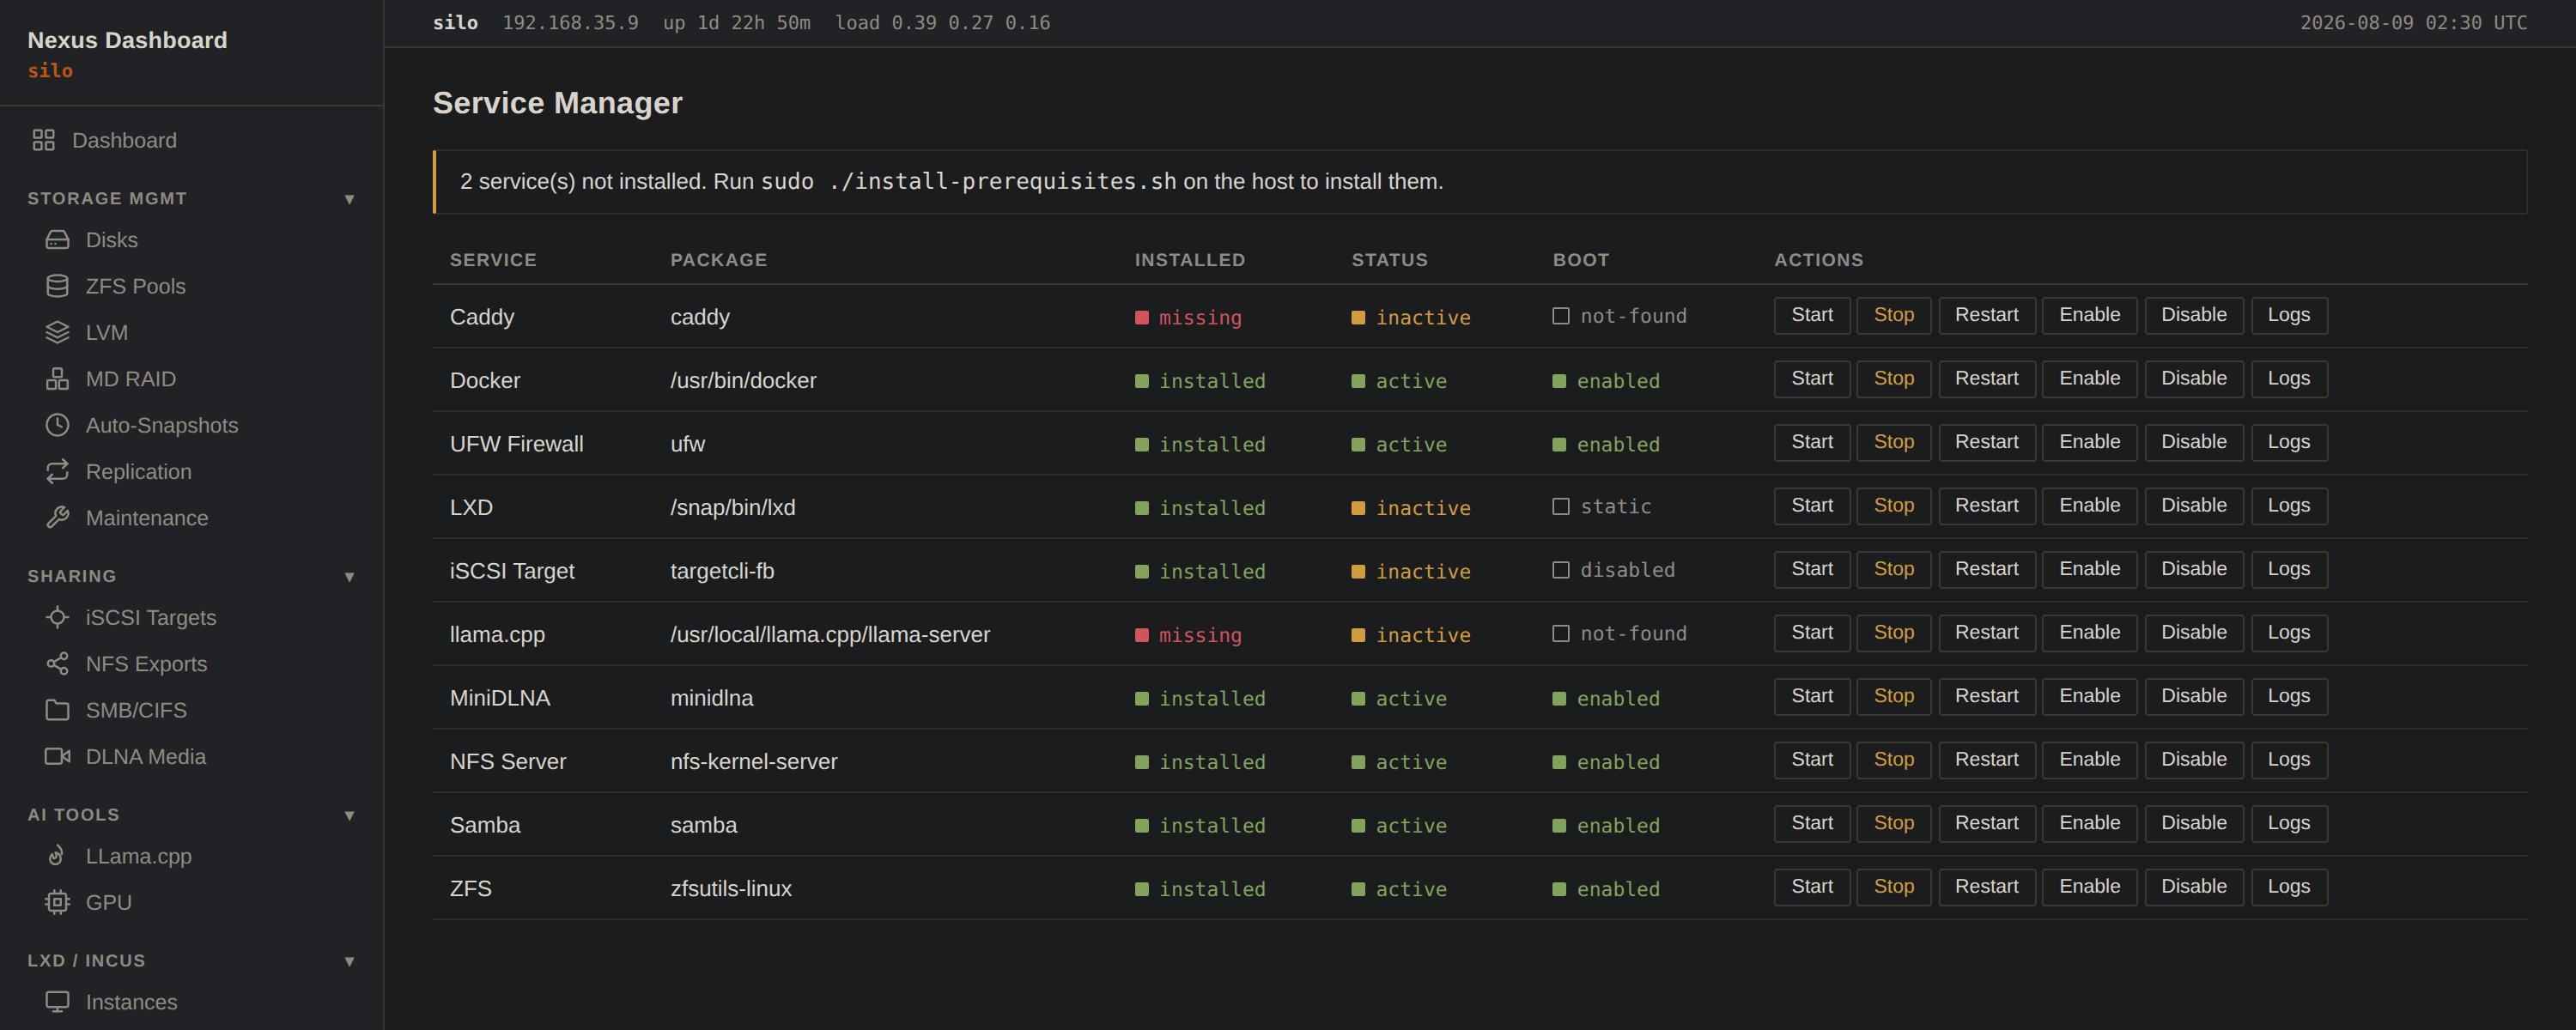
The Service Manager, and a good illustration of the point below: two of these services aren’t installed on this box at all. They’re reported as missing with an honest note about how to fix it, rather than being hidden or throwing an error.
Degradation guards are a feature, not error handling. Every module that fronts something optional refuses cleanly when that thing isn’t there. Enable the Docker module on a node with no Docker and the pages report the daemon unreachable rather than erroring; enable the DNS module on a storage box and nothing is written to disk until the prerequisites actually exist. Modules that only work under perfect conditions are modules you’re afraid to turn on.
Slow dependencies need their own thread, not a bigger timeout. Hypervisor APIs can take the better part of a minute to answer. Putting one of those in the request path of a fleet view means the fleet view is now as slow as your slowest hypervisor. They’re polled in the background into a cache instead, and the fan-out serves the last known good result. The enrollment probe seeds that cache so a freshly added host isn’t blank for a minute.
The bug that taught me the most wasn’t in my code. A node would occasionally go unreachable while systemd insisted the service was healthy. It turned out the development-grade WSGI server performs the TLS handshake in the accept loop, before dispatching to a worker thread. A client that dies mid-handshake without a reset ever arriving (a NAT black hole, say, when a container gets recreated mid-poll) wedges that single accept thread until TCP retransmission gives up, roughly twenty minutes later. Every connection after it queues, unserved. The dashboard looks down while the process is perfectly alive.
Nothing about that was findable in my application code, and it’s the reason exposed nodes now sit behind a real reverse proxy that owns the handshake, with the app bound to loopback behind it. Which is its own small lesson: the thing that finally made it reliable was giving a job to software that already did it better.
What this isn’t
Let me be clear about what I did not build. There’s no HA, no clustered control plane, no federated identity, and nobody to call at 3am. The controller is deliberately internal-only. It’s hardened, but it was written for a LAN, and I wouldn’t hang it off the open internet without doing more work first.
I also don’t think that’s the gap. Ten machines don’t drift apart because you’re missing a platform. They drift because nothing is looking at all ten at once. What I needed was one place to notice things, one authenticated path to fix them, and a record on both ends of what I did. That turns out to be a much smaller program than the enterprise version of the same idea.
Closing thought
None of the decisions I’m proudest of were features.
Letting the operating system be the source of truth is why you can use the CLI on these boxes without breaking anything, and it’s the whole reason the project exists. Refusing to give the controller any privilege is what makes it safe for one service to be able to reach every machine I own. Insisting that every command be an argument list is why a web app that runs zfs and systemctl doesn’t keep me up at night. Freezing the API contract before refactoring is why five years of tooling didn’t break when the architecture changed underneath it.
The features came easily after that: modules, plugins, adapters, guest control, forecasting. They came easily because of that. What I set out to build was a NAS interface that didn’t fight me. What I ended up with is a fleet, and the reason it holds together is a handful of rules I decided not to break.